
Time Period
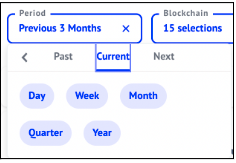
The Time Period filter feature enables the selection of the time period for which the analysis is to be visualized. Here there are 4 broad criteria namely “<” (highlighted with a red circle), “Past”, “Current” and “Next”.
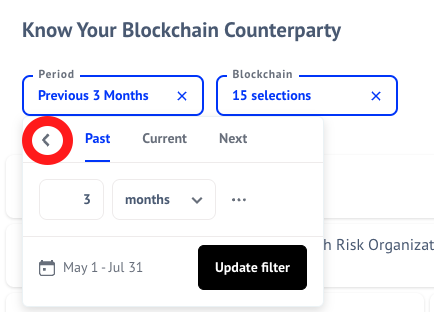
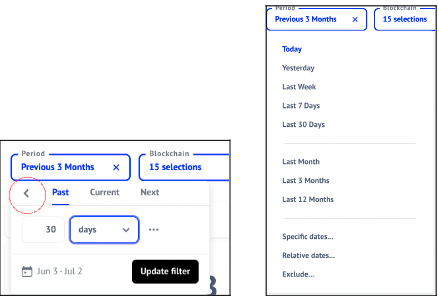
The “<” depicts custom rules already set for date selection like today, yesterday, last month, etc.
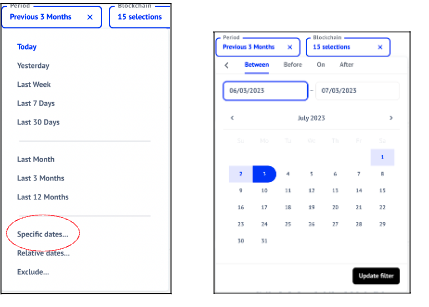
It also includes a way to specify dates between two specific dates. Using this, the users can also specify before, on or after dates in case they want to see the specific results.
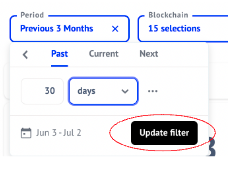
The relative date is by default set to last 3 months. However, users can choose from different granularities of time based on their needs. The figure below shows an example where the selection is for the last 30 days.
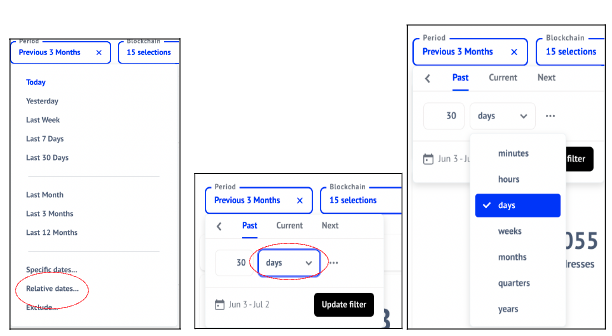
Similarly, the current tab allows the users to select the current day, week, month, quarter or the year.
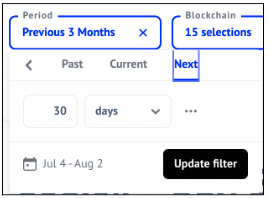
The “Next” tab allows users to select and filter for next “n” minutes/ hours/ days/ months/ quarter/ year. Note that for this example we have kept it for 30 days meaning here “n” is 30 and time granularity is days.
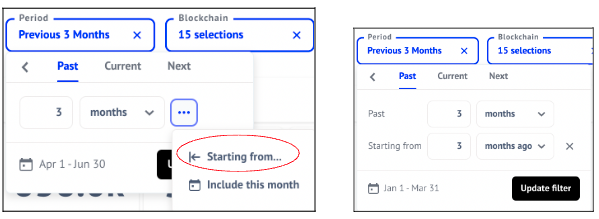
Note the three dots at the end of the granularity selection. This is available in the “Past” and “Next” tab. Using this, the user can select custom from date.
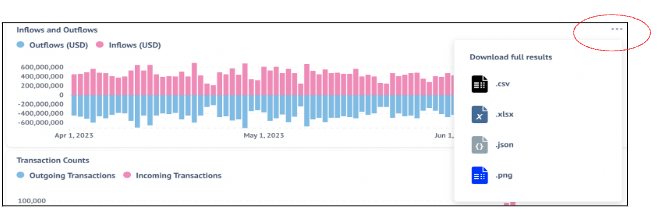
Once the selection is made via any of the above-mentioned modes, the user should click on the “Update filter” button. For clarity, the selected period dates would be displayed next to the “Update filter” button. This would ensure that the updates are reflected on the graphs accordingly.
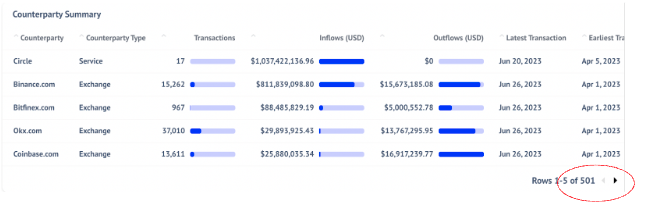
A counterparty is a named entity with which the VASP has interacted with. The table shows the counterparties that have interacted with the selected VASP. Here, the table shows the name of the counterparty, its type, number of transactions with the selected VASP, amount of inflow and outflow in USD, the latest transaction date and the first transaction date with the selected VASP.
Here, the transaction dates are specific to the selected VASP. Currently the table only shows the top 5 rows. To see more users can select via the arrow button on the right bottom corner of the graph (highlighted with a red circle).
Updated about 1 year ago