
Transaction level information
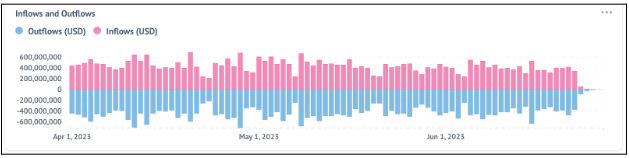
Post basic information, the Analytics section displays the inflows and outflows of funds over the selected period of time and over selected chains. The inflows are depicted in pink while the outflows are depicted in blue. The X-axis presents the selected time period and the Y-axis depicts the cumulative funds in USD that have moved on the particular date.
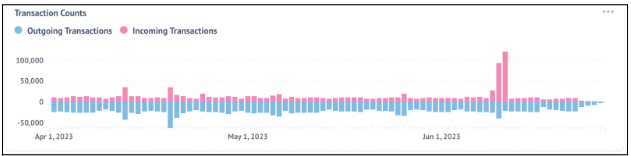
Following the inflow and outflow analysis, the tool presents the total number of transactions completed by the selected VASP in the selected period and in selected chains. Similar to the previous case, the number of incoming transactions are depicted in pink while the outgoing transactions are depicted in blue.
It's important to note that incoming transactions would include the transactions where any address of the selected VASP received funds while the outgoing transaction would include the transactions where any address of the selected VASP sent funds.
Furthermore, the X-axis presents the selected time period and the Y-axis depicts the number of transactions that happened on the particular date.
In all graphs there is a possibility of downloading the data in various formats like csv, xlsx, json and png. Users can click on the three dots to avail this feature as shown in the above image on the top right corner. Note that this feature is available for all the graphs displayed.
Updated about 1 year ago